
 monday.com · Guide
You added checklists to your monday.com items, people are checking things off, and yet you still can't answer the simple question a manager asks on Monday morning: are we on track? That's the gap this guide closes. Here you'll learn how to track checklist progress in monday.com at every zoom level — from a single item, to one board, to a portfolio of boards, down to what you personally owe today.
The trick is that progress lives on several surfaces, and each answers a different question. Wire up one column, then learn to read the four views built on top of it. SOP & Compliance Checklists by EmbedIn gives you all of them, and because it runs entirely on monday.com's own storage, none of your data leaves the account.
Start with the progress column
Before you look at any dashboard, connect checklist completion to a real board column. This is the single step that makes progress visible everywhere else — in the board table, in native monday.com dashboards, and in the automations you already run.
SOP & Compliance Checklists syncs each item's completion to a number or status column you choose. Once that's set, a half-finished checklist shows up as, say, 60% right in the board row, next to owner and status, with no extra clicks. You can also mirror the checklist's next due date to a native Date column, so monday.com automations — reminders, notifications, deadline rules — fire off the checklist instead of a separate field.
- Open any item and go to its Checklist tab.
- In the app's settings, pick the column that should hold progress — a number column for a percentage, or a status column for a coarse on-track / behind read.
- Optionally point the next due date at a native Date column so your existing automations can use it.
- Check a few steps and confirm the column updates in the board table.
Pick number for dashboardsA number column lets monday.com's native dashboard widgets average and chart your progress. A status column reads faster for humans but is harder to roll up numerically — many teams keep both.
Read progress across one board
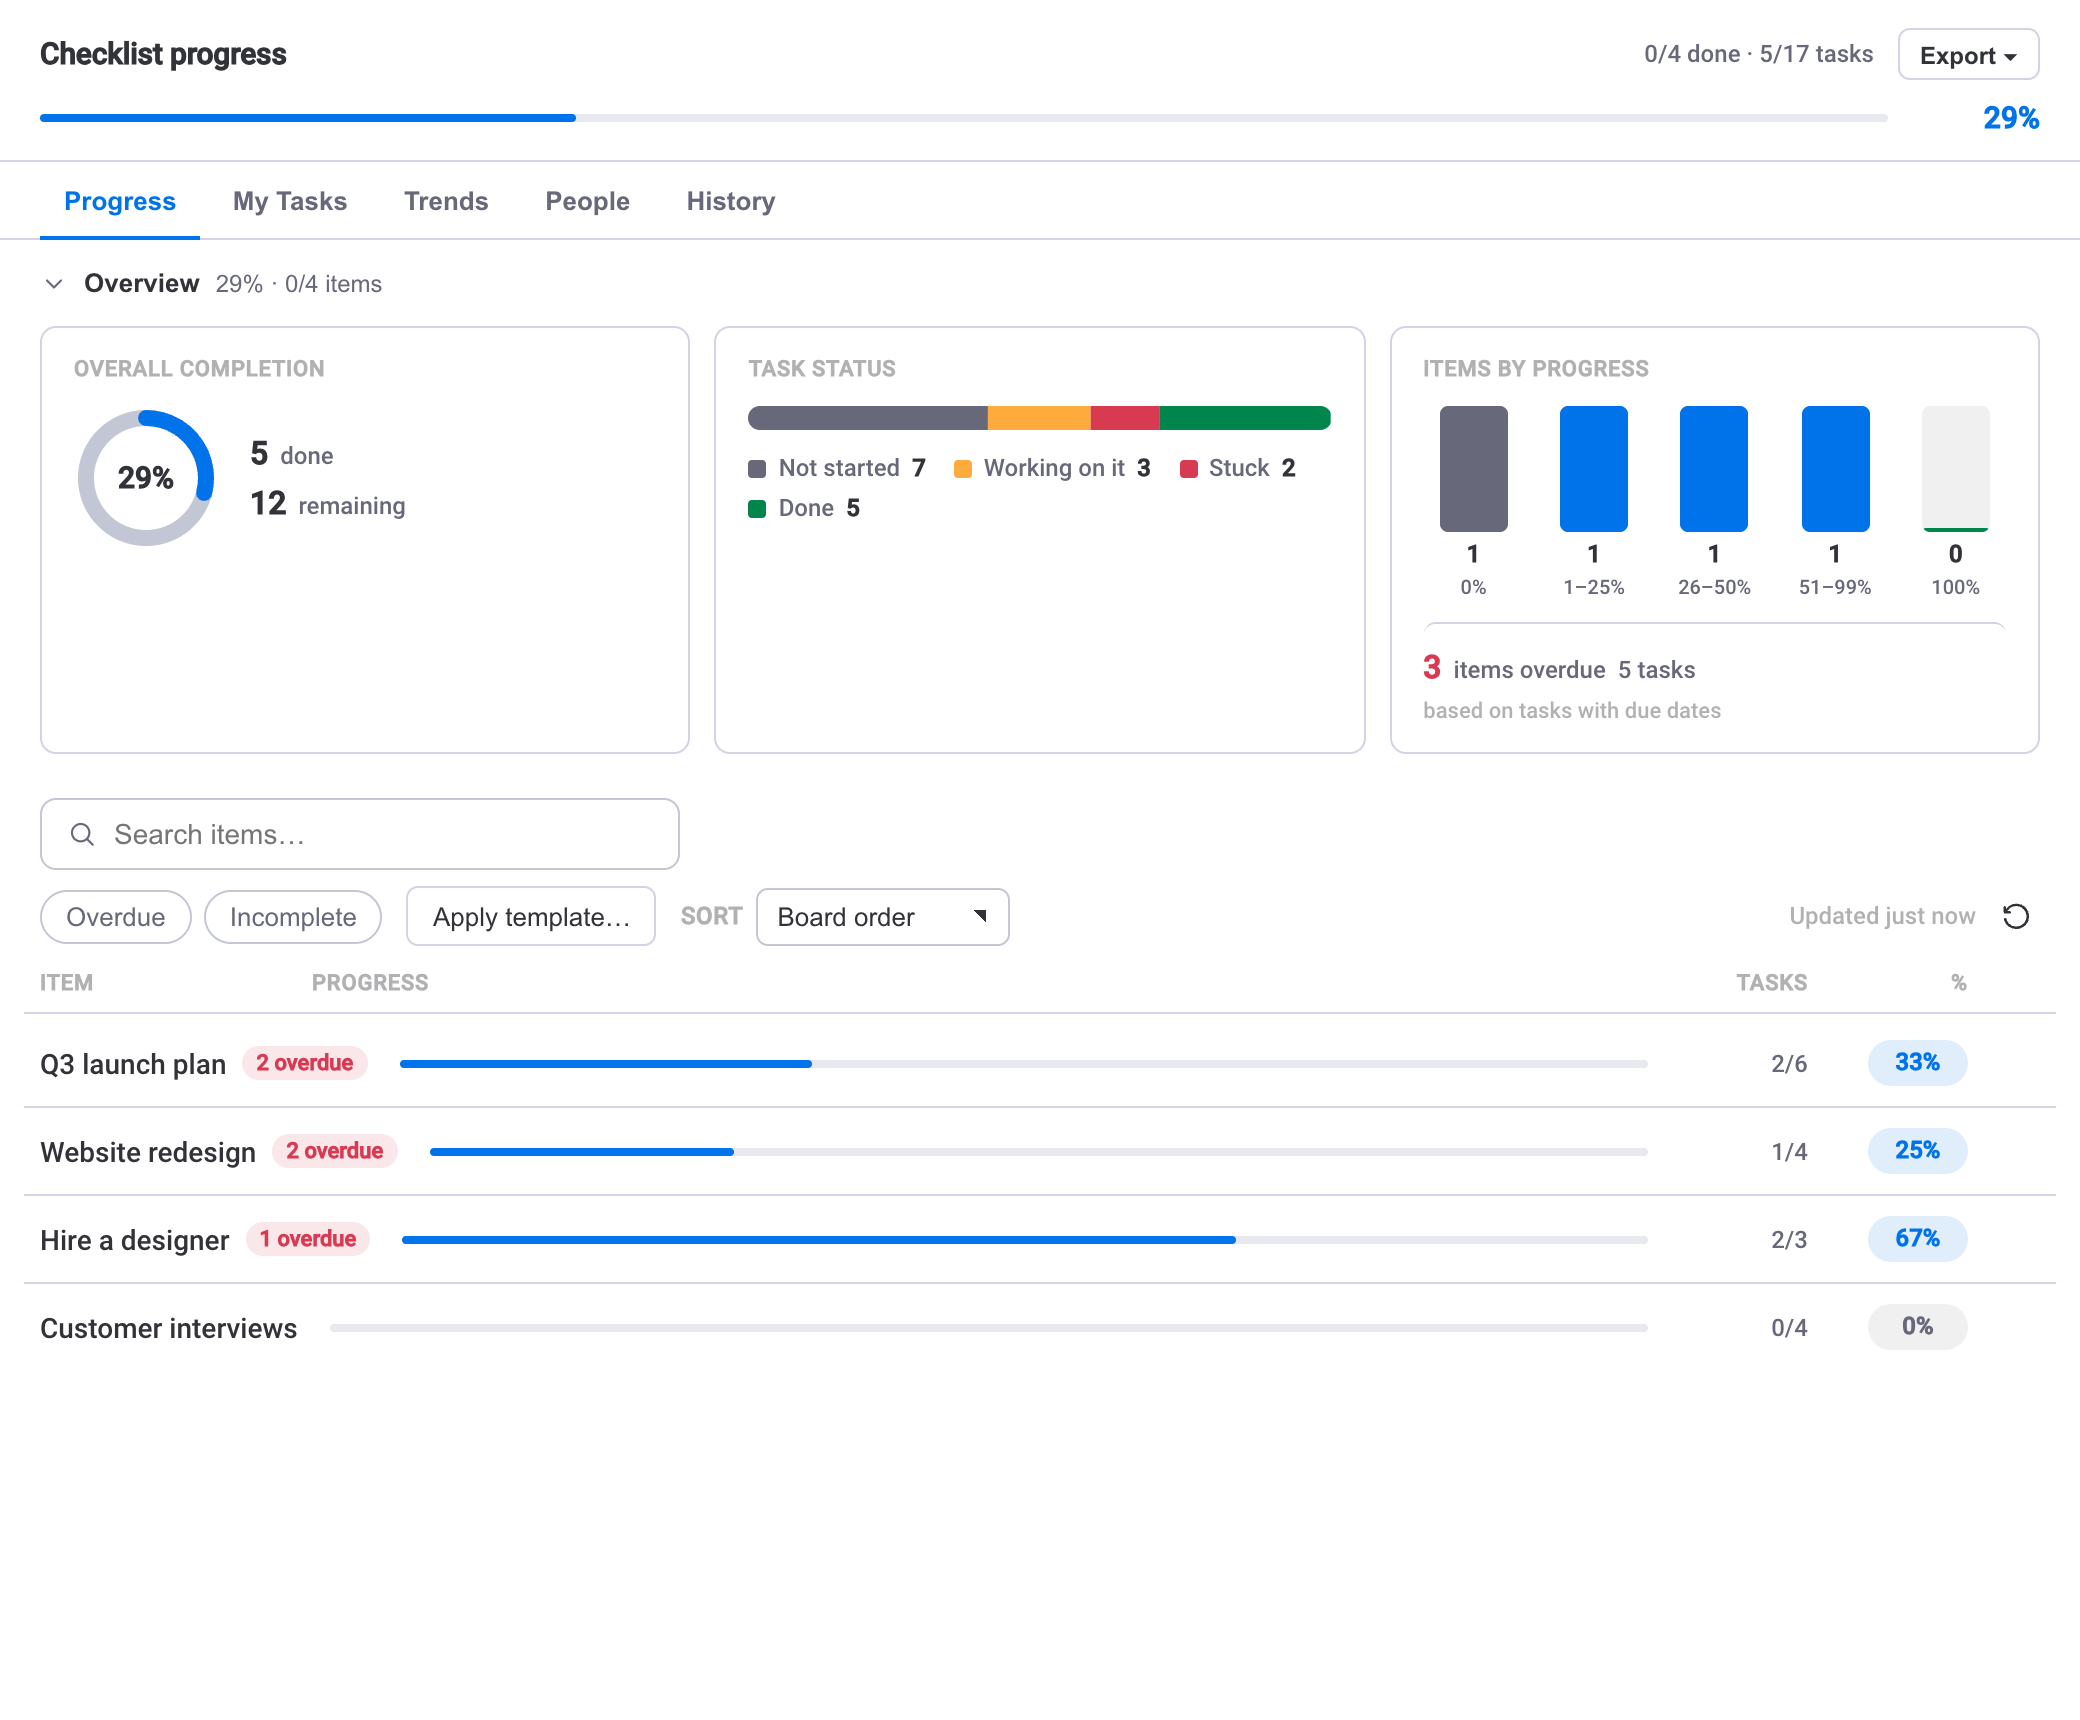
With the column in place, the board table already tells you a lot. But to see checklist detail for every item at once — not just a single percentage — open the app's Board View. It's a per-item progress table for the whole board: an overview up top, a task-status breakdown, and progress buckets so you can tell finished work from work that hasn't started.
You get search, sort and filter, so "show me every item under 50%" or "sort by least complete" takes a couple of clicks. This is the view for a standup or a weekly board review, when you want the shape of the whole board without opening items one by one.
If you're still deciding whether checklists are even the right structure for this board, it's worth reading checklists vs. subitems in monday.com first — the two track progress very differently.
Roll up across multiple boards
One board is rarely the whole picture. When work spans several boards — one per team, per client, per quarter — use the Dashboard widget. It rolls checklist progress up across multiple boards, with a per-board breakdown so you can see which board is dragging, and a needs-attention list that surfaces the items most at risk of slipping.
This is the portfolio view: the answer to "how is everything doing?" without hopping between boards. Add it to any monday.com dashboard alongside your other widgets.
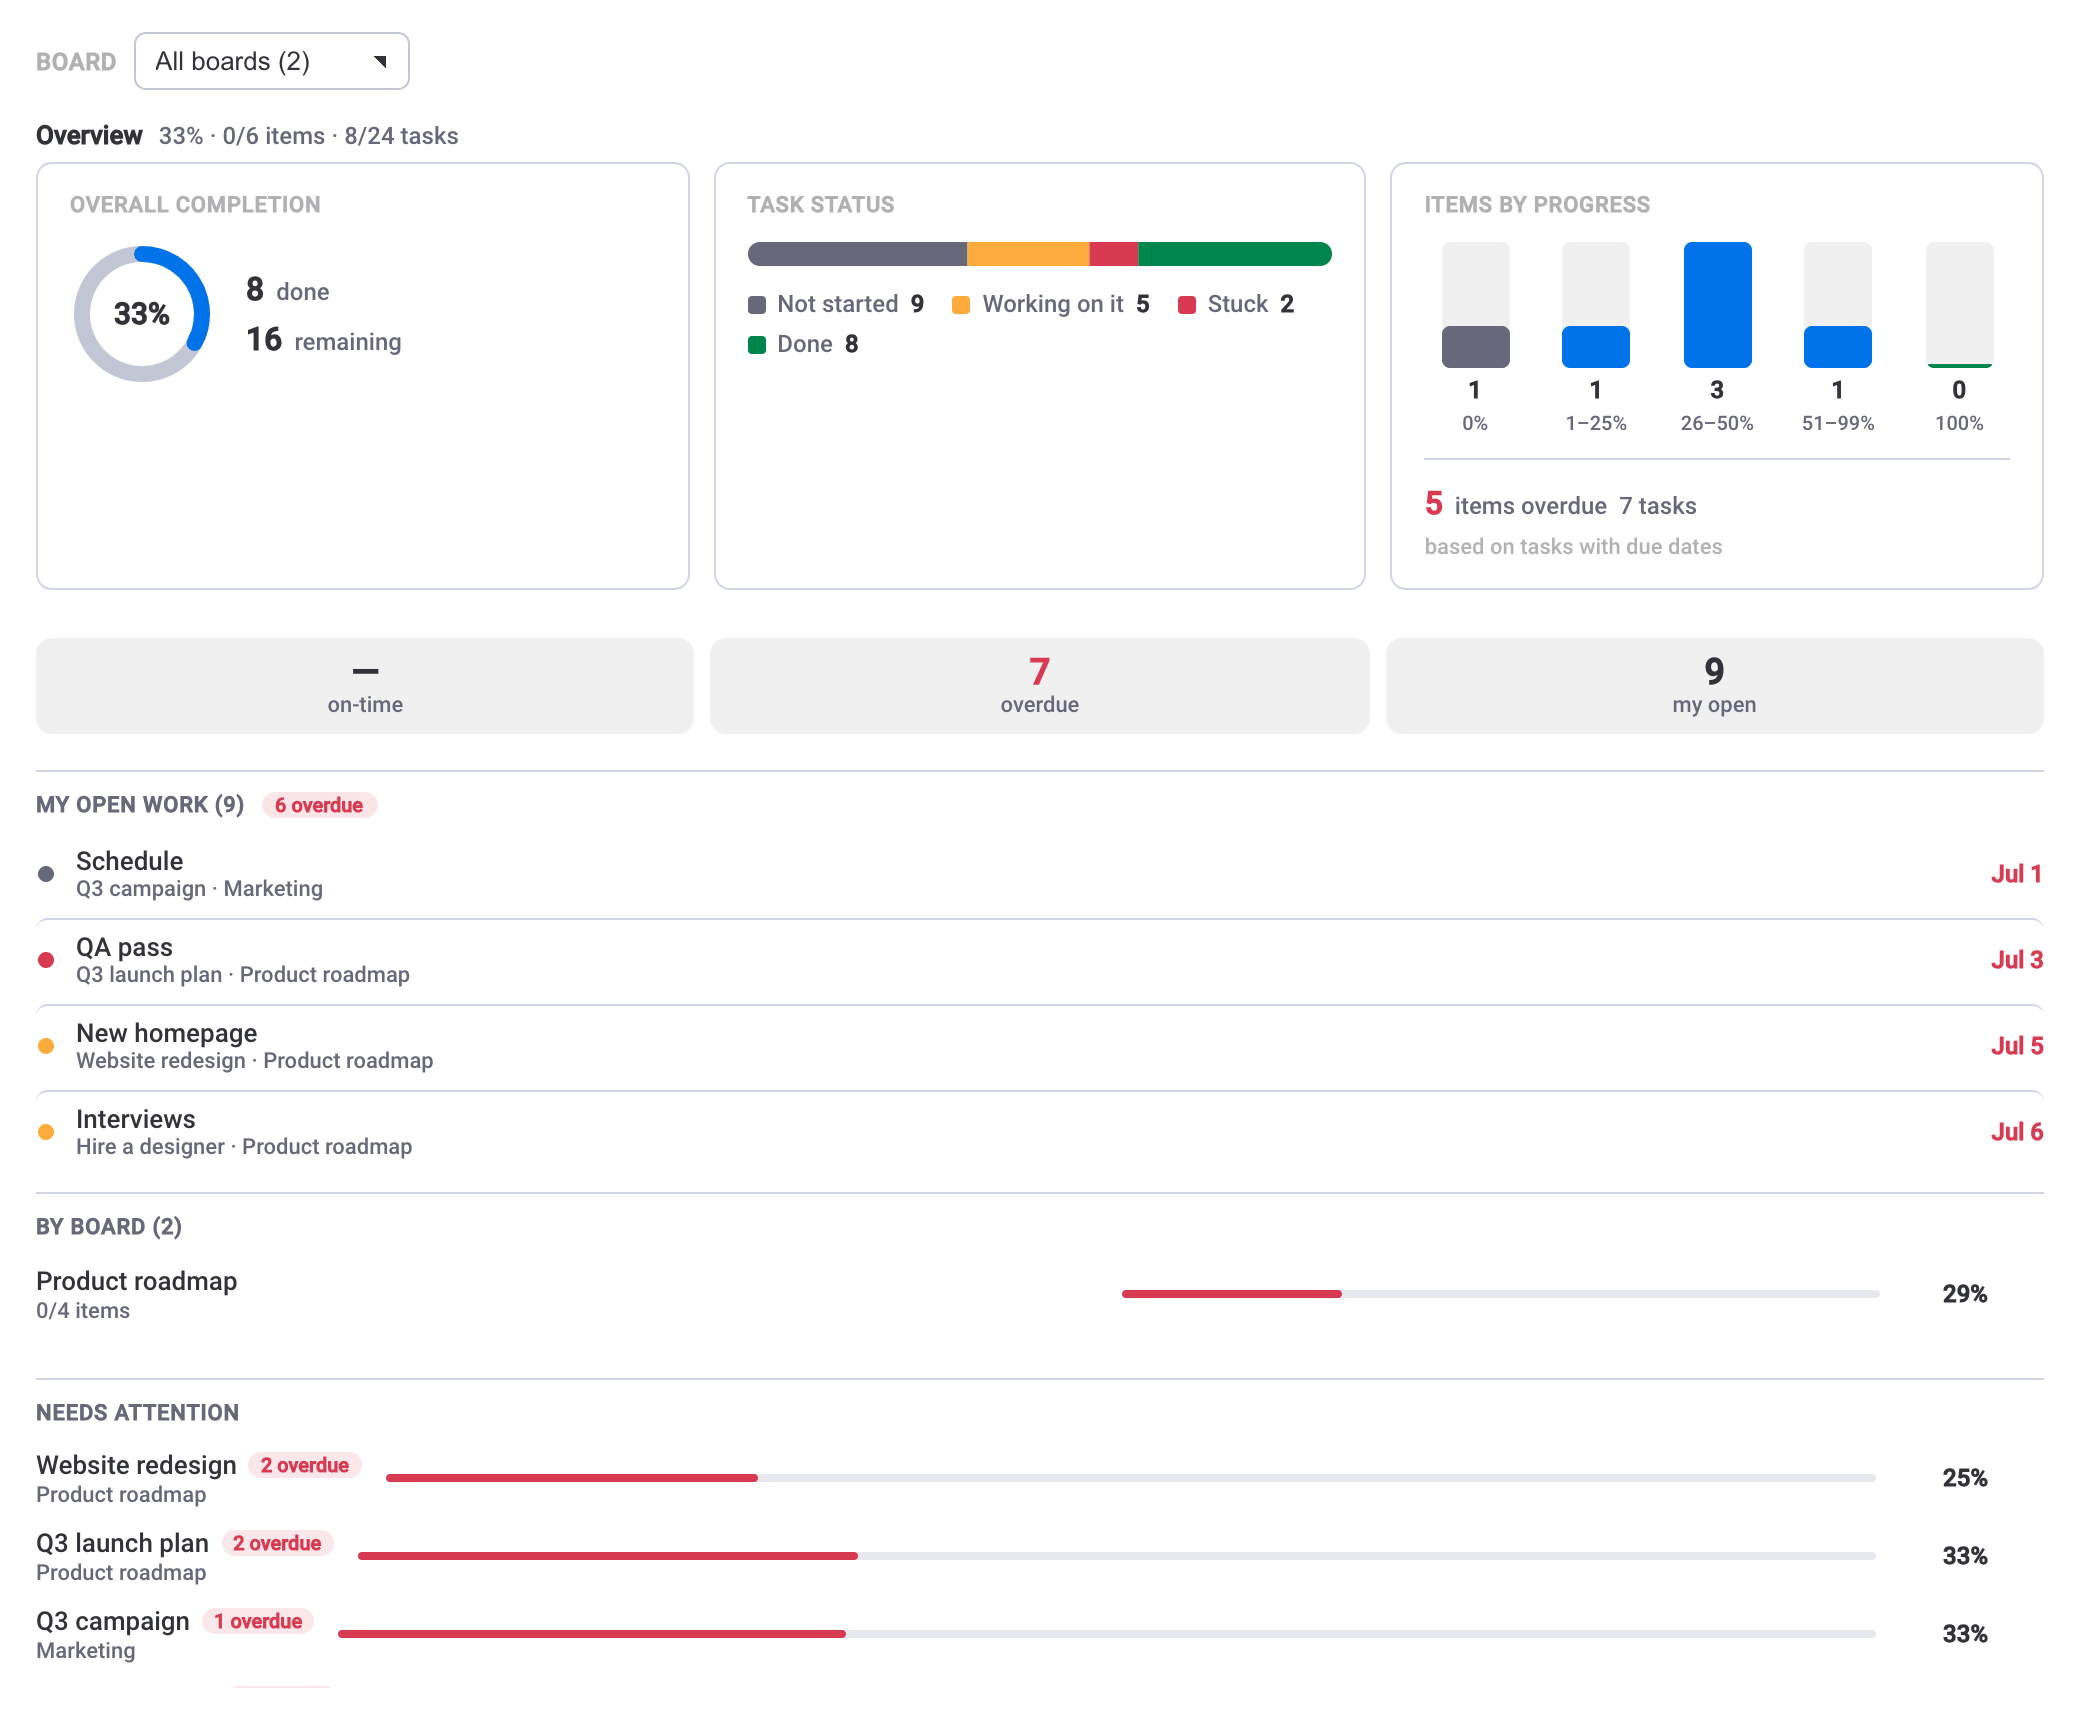
Two ways to roll upThe app's own dashboard widget aggregates checklist detail directly. Because progress also syncs to a column, native monday.com widgets can chart that number too — handy if you want checklist completion sitting next to unrelated board metrics.
The individual view: My Tasks
Board-level and portfolio views answer the manager's question. My Tasks answers the individual's: what do I owe, and when? It gathers every checklist task assigned to you across the board and groups them by due date, so nothing hides three items deep in a checklist you haven't opened today.
You can tick a task, change its status, or re-date it right there — no need to open the parent item. For monday.com task completion at the personal level, this is the surface people actually live in day to day. Give each step a clear owner and due date and My Tasks does the rest.
Progress you can't see at your own level is progress you won't act on.
Read the trend with analytics
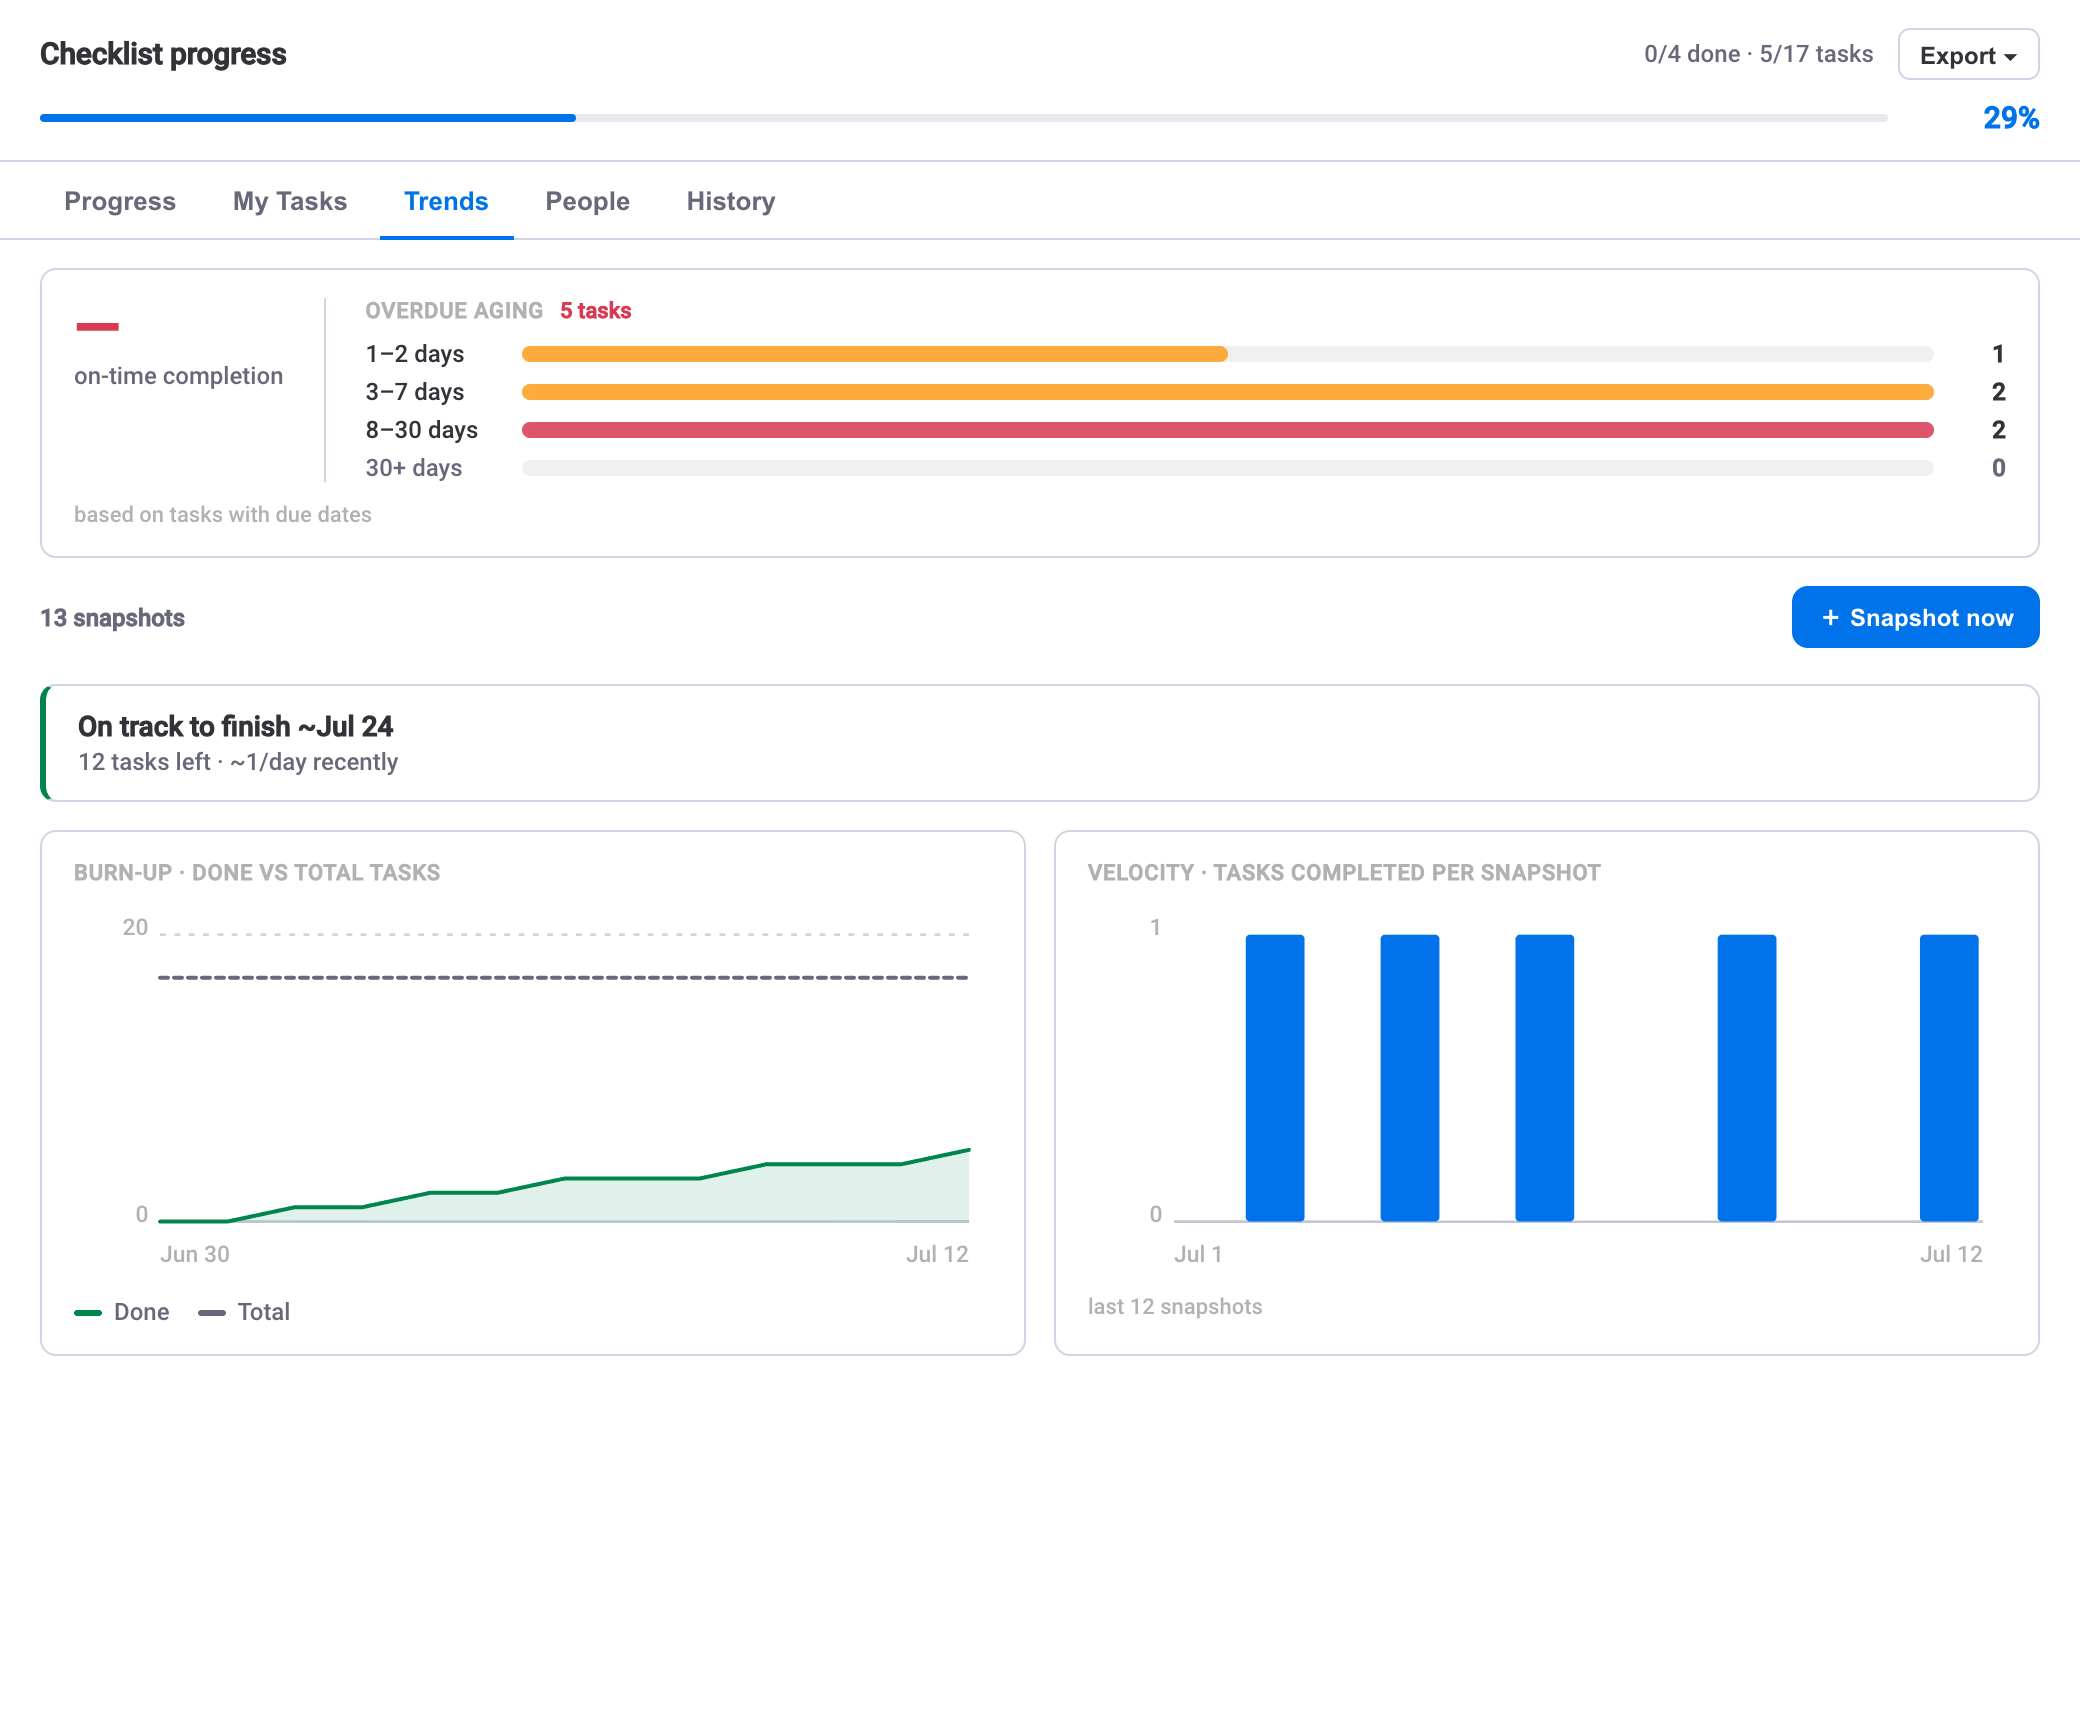
A single percentage tells you where you are. It doesn't tell you whether you'll finish in time. That's what the Analytics view is for. Built from daily snapshots, it shows a burn-up chart and velocity trend, a projected finish date based on your recent pace, per-person workload, and an on-time SLA so you can see how often work lands by its due date.
Read the four surfaces together and you have a full progress picture: the column for the board table, Board View for one board, the dashboard widget for many, My Tasks for the person, and Analytics for the trend. If your checklists repeat every sprint or every week, pair this with recurring checklists in monday.com so the tracking resets cleanly each cycle.
- Column — one number in the board row, visible everywhere and usable by automations.
- Board View — every item on one board, with buckets and filters.
- Dashboard widget — many boards rolled up, with a needs-attention list.
- My Tasks — your own tasks, grouped by due date.
- Analytics — burn-up, velocity, projected finish and on-time SLA.