
 Jira · Guide
A single ticket that has sat untouched for two weeks is annoying. A whole column that quietly fills up while nobody notices is what actually blows your dates. Most Jira workflow bottlenecks are the second kind: a status where issues arrive faster than they leave, so work piles up in one place and the team feels busy while throughput drops. The problem is that Jira's default board makes this hard to see. A busy column and a stuck column look almost identical at a glance.
This article is about finding the systemic constraint, not chasing one late issue. If you want to track down individual laggards, that is a different job covered in how to find stuck Jira issues before they blow a deadline. Here the question is narrower and more useful for planning: which status is your bottleneck, how do you prove it, and how do you catch it forming rather than reading about it in the retro.
A bottleneck is a column, not a ticket
It is worth being strict about the vocabulary, because the two problems have different fixes. A stuck issue is one item that has aged past what you would expect for its status: a bug parked in Code Review, a story someone forgot to move on. You fix it by nudging one person. A workflow bottleneck is a structural property of the process: a status that consistently accumulates work because the capacity feeding out of it is lower than the demand flowing in. You do not fix that by chasing tickets; you fix it by changing staffing, WIP policy, or the workflow itself.
The tell is repetition. If issues keep aging in the same status, week after week, regardless of which people are involved, you are not looking at bad luck. You are looking at a constraint. That is the thing worth finding, because every hour of delay it adds is multiplied across everything that has to pass through it.
A stuck issue is a person who forgot. A bottleneck is a place where the work will always pile up until you change the process. Treat them the same and you will keep firefighting the same column forever.
The three symptoms of a Jira workflow bottleneck
Before you measure anything, you can usually spot a bottleneck by its behaviour on the board. Three signs tend to show up together, and any one of them is worth a closer look.
- Queue growth in one status. The card count in a single column climbs over successive days and does not drain, even as other columns turn over normally. Work is arriving faster than it leaves.
- Rising time-in-status. The average dwell time for that status trends upward. Issues that used to clear it in a day now take three. This is the metric that predicts slips, covered in time in status in Jira.
- WIP concentrating. A larger and larger share of everything in flight is sitting in the same place. If half your active issues are in one status, that status is almost certainly your constraint.
Busy is not the same as blockedA column with a lot of cards is not automatically a bottleneck. A bottleneck is a column where cards arrive faster than they leave. Watch the direction of the count over days, not the count on any single day, or you will mistake a healthy busy stage for a constraint.
How to identify which status is the constraint
To turn a hunch into a decision you need per-status numbers, not a gut feel about the board. Work through your statuses and, for each one, ask two questions: how long does a typical issue sit here, and is that duration getting worse over time. The status with the highest and rising dwell time is your candidate constraint.
There is a quick sanity check that catches most cases. Walk the workflow left to right and find the first status where the queue in front of it never empties. Upstream of the true bottleneck, work flows fine. At the bottleneck, a queue forms and stays. Downstream, stages are often starved because everything is waiting behind the constraint. If Testing is always short of work while Code Review is always full, the bottleneck is Code Review, not Testing.
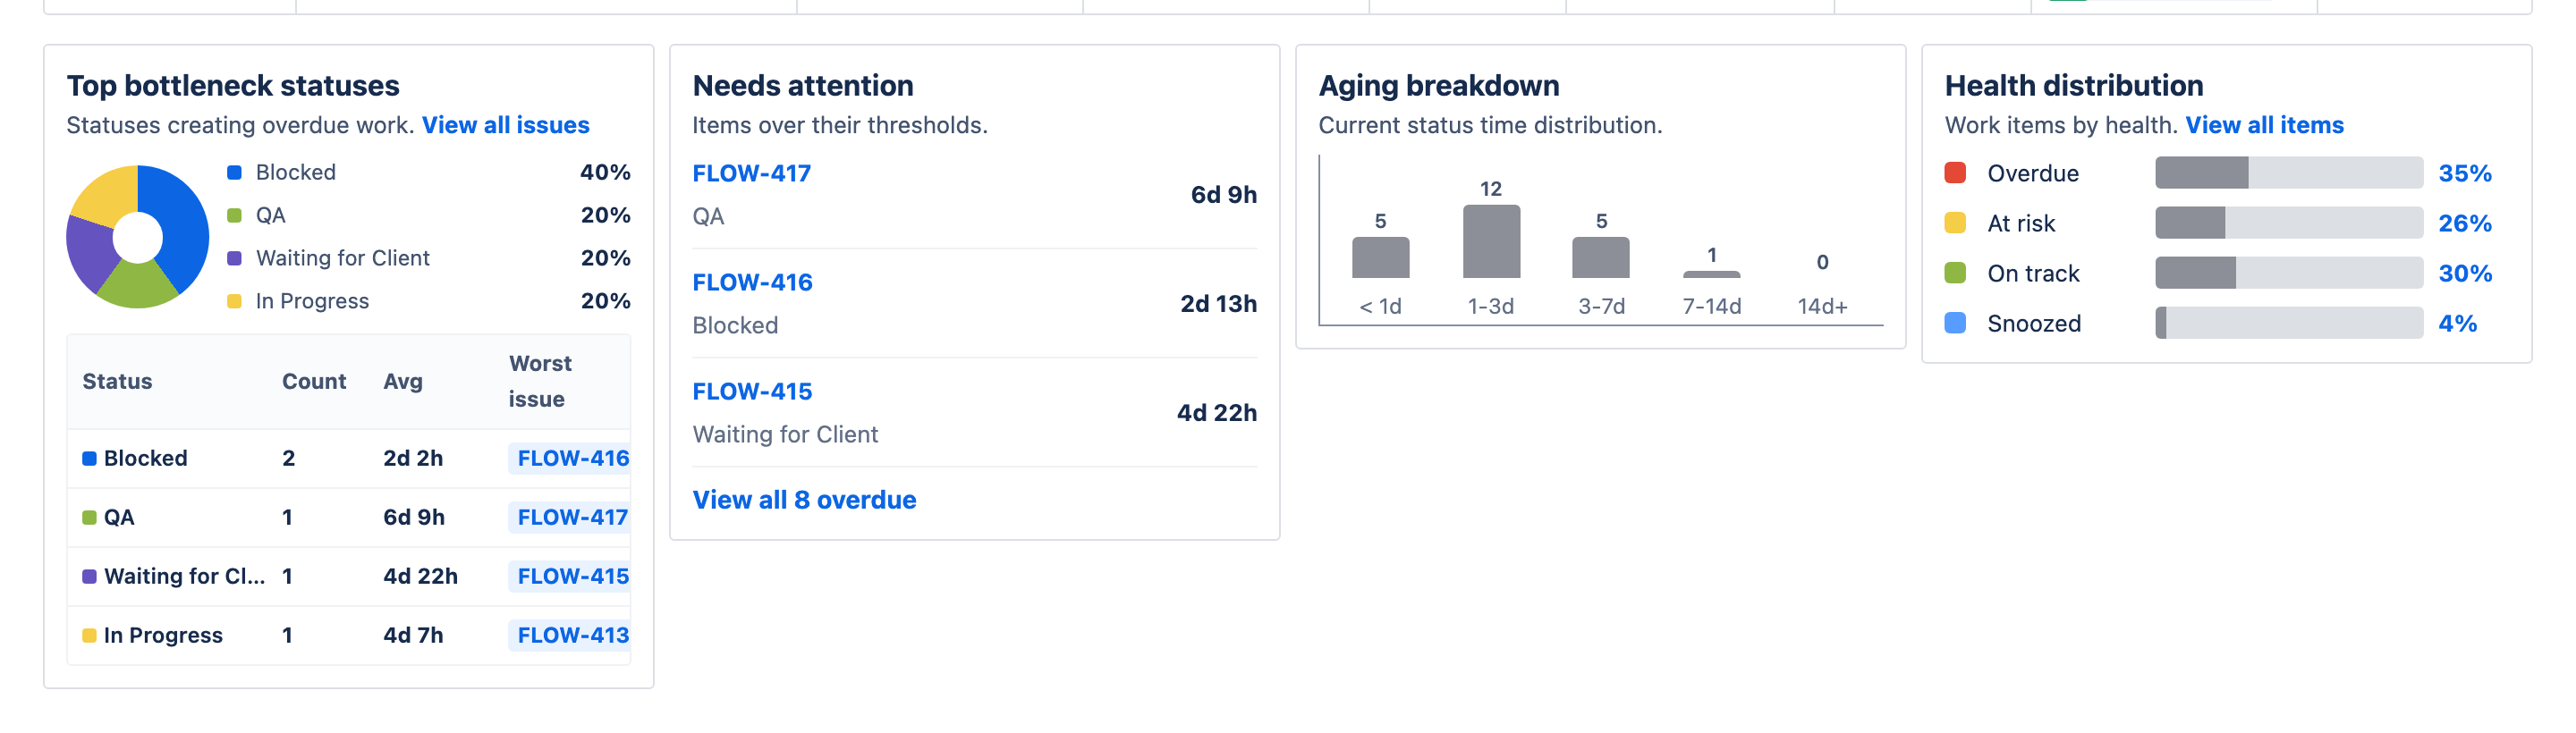
This is exactly the view Time in Status — Status Aging Alerts for Jira gives you. It measures time-in-status for every issue, and its Top bottleneck statuses card ranks the columns where dwell time is concentrating — with a time-in-status matrix report that shades the worst cells red — so the constraint stops being a guess.
WIP limits and per-status thresholds make it obvious
Two policies turn bottleneck-hunting from an investigation into an alarm. The first is a WIP limit on each status: a cap on how many issues are allowed to sit there at once. When a column keeps bumping against its limit, the constraint announces itself. The second is a per-status ageing threshold: the length of time an issue is expected to spend in a status before it counts as ageing. Set a threshold that reflects reality for each status, since Code Review and In Progress do not deserve the same clock.
These two ideas reinforce each other. WIP limits keep the queue in front of the constraint from hiding the problem; thresholds tell you the moment individual issues in that queue start rotting. The relationship between the two, and how they feed service-level expectations, is worth reading in Jira WIP limits, status aging and SLAs.
Set thresholds per status, not globallyA single number across the whole workflow will either be too loose for fast stages or too strict for slow ones. Give each status its own expected dwell time. When issues in one status routinely blow their threshold, that status is your bottleneck, and the alert fires while there is still time to react.
Catch the bottleneck forming, not at the retro
The reason bottlenecks hurt is timing. By the time a slipped sprint makes the constraint obvious, the damage is done and everyone is arguing about it in the retrospective. The value of status aging alerts is that they change when you find out. Instead of noticing the pile-up after the fact, you get told the day a status starts exceeding its expected dwell time, while you can still add a reviewer, split the work, or renegotiate scope.
This is the difference between a lagging and a leading indicator. Cycle time and missed deadlines are lagging: they confirm a bottleneck existed. Rising per-status dwell time is leading: it shows the bottleneck forming. If you want to act on the cause rather than the symptom, watch the leading indicator, which is the same signal you would use if you were trying to reduce cycle time in Jira.
What to do once you have found it
Finding the constraint is most of the work, but it is not the point. Once you know which status is your Jira workflow bottleneck, a few responses tend to help, in rough order of effort.
- Add capacity at the constraint. Pull people toward the bottleneck status rather than starting new work upstream. More work-in-progress before a constraint just lengthens the queue.
- Reduce demand into it. Tighten the WIP limit on the stages feeding the bottleneck so the queue stops growing while you address the cause.
- Change the workflow. If a status is a bottleneck by design, for example a single mandatory reviewer, the fix is structural: more reviewers, parallel paths, or removing a handoff.
- Keep watching the threshold. Constraints move. Fix one and the bottleneck often shifts downstream. Keep dwell-time thresholds on every status so you see the next one form.
None of this requires heroics. It requires seeing the constraint clearly and early, which is a measurement problem before it is a management one. Get the per-status ageing numbers in front of the team, and the conversation shifts from blame to the one column that actually needs attention.